
SoFi Q4 2024 Earnings - What I got right and what I got wrong

SoFi’s full fiscal 2023 is now in the books. I like to take accountability for my predictions and see what I got wrong, what I got right, and what I learned, and that’s the purpose of this post. I’ll start by covering my predictions compared with actual results
New Members
I thought SoFi would end up with 630k new members and they came in with 585k. If it weren’t for their absolute blowout Q3 number here, this quarter would look a lot better. As is, I’m good with this result. This quarter was never about member adds, it was about profitability, so despite the fact that Q4 is historically the best quarter for member adds, it makes sense that they pulled back here in Q4 2023.

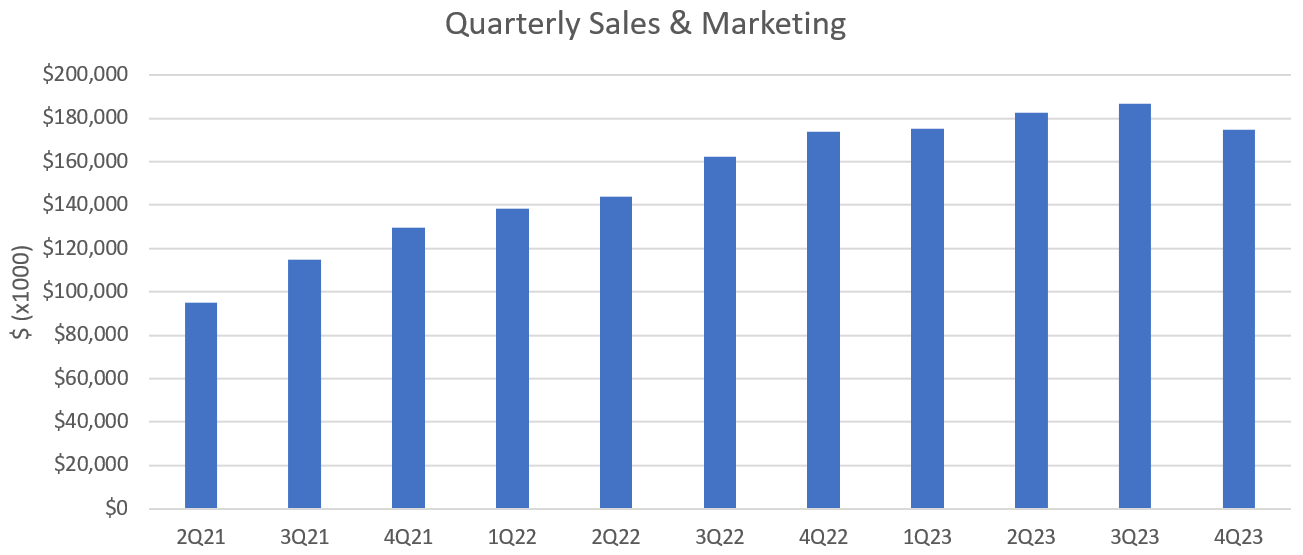
SoFi was vigilant about their expenses this quarter as well, almost certainly to guarantee they’d hit profitability. In fact, it is the first time ever as a public company that their sales & marketing spend decreased QoQ. It was the lowest S&M quarter of 2023, and basically flat from Q4 2022. They added 585k new members this quarter compared to 480k in 4Q 2022 for essentially the same marketing spend. Marketing efficiency is still improving and it appears brand awareness really does make a difference.
Originations and Lending
Alright, here is where I was wrong. I was too bullish on the lending segment. My assumption was that they would guide for and still have growth in lending in 2024 compared to 2023. This was the root cause of a lot of my errors in judgement for this quarter and for 2024. I absolutely think that 2024 will end up being a better year for lending than they are forecasting, but I erred here in my process.
SoFi is taking a very conservative stance on the macro environment in 2024. They’ve already begun to pull back, with only $3.2B in personal loans originated in Q4 (from $3.9B in the prior quarter. What’s more, I expected a large tailwind in student loan originations as repayments started. I was very surprised to see that SL originations actually decreased QoQ from $919M to $790M. I predicted $3.57B in PLs and $1.6B in SLs, respectively. This puts a major dent in my thesis that 2024 would see significant growth in the business from the return of student loans.

My thesis was that they’d be able to originate and sell student loans because of the increased demand from refinancing as students got hit with payments again and because the new loans would be originated at high enough rates to be attractive to loan buyers. It appears that their thought process is that if the environment stays higher for longer and liquidity stays tight, it is better to have higher yielding personal loans on the books rather than student loans. The origination data from this quarter make me believe this is the scenario SoFi are planning for and executing on. That leaves some upside if the macro stays strong and they can pivot, but not as much as I’d planned on in my projections.
Deposits
I was very close here. I predicted $2.92B in new deposits and they ended up with $2.95B.

Revenue
Lending
As I stated earlier, I was entirely too bullish on the lending segment, and the lower originations here led to basically flat revenue in the segment. It went from $342.5 to $346.5M from Q3 to Q4, whereas I had predicted $366.5M.
Financial Services
Financial Services continued its strong growth, with another ~$21M of QoQ growth. I predicted $140M in total revenue and it came in at $139M.

Technology Platform
***EDIT*** I had a transcription error in my spreadsheet and had the revenue at $92.6M for some reason instead of the accurate number which was $96.9M, so this section has changed since I first published it and I’m more constructive on the Tech Platform as a result.
Growth here was not as high as I’d hoped for but still very good. TP revenue was $96.9M. I was looking for $98M. Contribution margin was in the low 30s at 31.6%. I thought it’d end up slightly higher than that as well. Part of that was because I thought revenue would be higher and bump up the margin. If they can continue this same QoQ growth over the next year, that would be 35% YoY growth, which would be excellent. I want the tech platform to grow consistently above 30%. It needs to continue to accelerate from here and hopefully this is a true inflection point in the business.

Corporate Revenue
The outperformance in SoFi’s revenue came from a very unexpected source this quarter. Corporate revenue had a huge jump this quarter. Corporate revenue has hovered very consistently around the -$20M mark every quarter for a full year. It jumped to $11.7M in Q4 2023.

We know that part of this increase was due to them buying back a portion of their senior convertible notes. However, the graph above is taken from their adjusted net revenue numbers, which already exclude the revenue that came from buying back their debt. If that revenue were included, it would add an additional $14.6M of corporate revenue. There is not much info in the press release or the investor presentation to figure out where this large swing in revenue came from or whether it is sustainable in the future. Hopefully the 10-K will shine some light on it when it comes out because I don’t know how to explain it. If somebody else has a good answer, please feel free to share it with me.
Adjusted EBITDA
I’m proud of my analysis here as well. The main point of my analysis was to highlight that SoFi was going to drop an extremely high percentage of any revenue growth straight to the adjusted EBITDA line. Between Q3 2023 and Q4 2024, SoFi grew revenue by around $63.5M. Adjusted EBITDA grew $83.2M in the same quarter. SoFi was so cost conscious in the quarter that they actually grew profits by more than they grew revenue, and achieved a 131% incremental EBITDA margin in the quarter. That means for every $1 of revenue growth in the quarter, they had $1.31 in EBITDA growth. I projected $145M of adjusted EBITDA in the quarter and they blew that away with $181.2M
GAAP Income and EPS
If you look at their GAAP numbers, SoFi’s net income for the quarter was $47.9M, which is a massive beat above the $27M that I projected. However, that number includes $10.1M in dividends on preferred shares that get subtracted out before calculating EPS and another $13.1M of benefit that is deducted prior to calculating EPS from buying back some of their senior convertible notes. That means when you calculate fully diluted GAAP EPS, you are left with $0.02. The basic EPS does not exclude the benefits from the convertible note repurchase and came out to $0.04. This was significantly above analyst estimates. They killed it here.
Guidance
I alluded to this earlier, but my bullishness on lending led to me being off with my guidance prediction as well. I assumed that lending would show some nominal growth in 2024 and took that as the baseline when I calculated revenue for 2024 based on the 50-50 revenue split between lending and financial services/tech platform. Here was SoFi’s guidance slide.

2023 lending revenue was $1,336M, financial services was 436.5M, and the tech platform was $348M. If you assume 92%-95% of 2023 revenue and a 50-50 split, that leads to $2.46B-$2.54B in revenue. My prediction was that they would guide for $2.6B-$2.7B. Their adjusted EBITDA guide was $580M-$590M, which came in right in the middle of of my guess of $560-$610M, so I think I nailed that one.
Predictions vs Actual
Predictions in one place for easy reference:
New members: Prediction: 630k - Actual: 585k
Personal loan originations: Prediction $3.57B - Actual $3.2B
Student loan originations: Prediction $1.6B - Actual $790M (ouch, I was way off here)
New deposits: Prediction: $2.92B - Actual: 2.95B
Lending revenue: Prediction: $366.5M - Actual: $346.5B
Financial Services Revenue: Prediction: $140M - Actual: $139M
Technology Platform Revenue: Prediction: $98M - Actual: $96.9M
Corporate Revenue: Prediction: -$18.5M - Actual: $11.7M
Total adjusted net revenue: Prediction: $586M - Actual: $594M
Adjusted EBITDA: Prediction: $145M - Actual: $181.2M
GAAP Net Income: Prediction: 27.1M - Actual: $47.9M (a closer approximation to my projection would be $34.8M excluding the benefit from the debt repurchase)
GAAP EPS: Prediction: $0.028 - Actual $0.04 (my projection is closer to the basic EPS they gave)
Predictions for SoFi’s FY 2024 Revenue Guidance: Prediction: $2.6B-$2.8B - Actual: $2.46B-$2.54B
FY 2024 EBITDA Guidance: Prediction: $560M-$610M - Actual: $580M-$590M
Conclusion
All models and projections are wrong…and mine were too. This is not a surprise. Overall, I’m very enthused by the SoFi earnings but there are some questions I’m left with after reviewing of the results. The first one is regarding the corporate revenue and how sustainable it is moving forward. Given the downward guidance for Q1 2024 relative to what we just saw in Q4 2023, I think it might end up being something of a one off thing.
I also still want to see more growth from the tech platform. I understand that things there take a long time to develop, but I would want to see that segment sustainably get above 30% YoY growth. If you take their last quarter’s growth rate and annualize it, it’s 35%, so let’s hope this trend continues.
Their continued ability to correctly anticipate their revenue and profitability and to deliver on their promises is second to none. I’m again left very confident that management knows exactly what they are doing, has a concrete plan in place, and is executing on that plan. I think 2024 will be an excellent year for the SoFi as a company and as a whole I am very encouraged by the business trajectory.
Subscriber update
I keep inching toward the YouTube channel goal of 100 paid subscribers. I’ve seen a decent boost in the past couple months and I am extremely grateful to those that are supporting the substack.
Right now I am comfortable with taking the time to write about 2 articles every month. Once I get to 100 paid subscribers, I’ll start a YouTube channel and do at least one video every other week (I plan on also posting those on X).
Paid subscribers also get access to a private X chat. If you are a paid subscriber and not in the chat, please email me at datadinvesting@gmail.com and let me know and I’ll get you added
Disclosures: I have a long position in SOFI.
The information contained in this article is for informational purposes only. You should not construe any such information as legal, tax, investment, financial, or other advice. None of the information in this article constitutes a solicitation, recommendation, endorsement, or offer by the author, its affiliates or any related third party provider to buy or sell any securities or other financial instruments in any jurisdiction in which such solicitation, recommendation, endorsement, or offer would be unlawful under the securities laws of such jurisdiction.
Great write up as always! Thank you for your time and effort on these and for always giving a balanced perspective!
FTP Credits? For the corporate revenue.
During the first quarter of 2022, we implemented a funds transfer pricing (“FTP”) framework to attribute net interest income to our business segments based on their usage and/or provision of funding. The primary objective of the FTP framework is to transfer interest rate risk from the business segments by providing matched duration of funding of assets and liabilities to allocate interest income and interest expense to each segment. Therefore, the financial impact, management and reporting of interest rate risk is centralized in Corporate/Other, where it is monitored and managed. Under the FTP framework, treasury provides a funds credit for sources of funds, such as deposits, and a funds charge for the use of funds, such as loan originations and credit card. The process for determining FTP credits and charges is based on a number of factors and assumptions, including prevailing market interest rates, the expected duration of interest-earning and interest-bearing assets and liabilities, contingent risks and behaviors, and our broader funding profile. As the durations of assets and liabilities are typically not perfectly matched, the residual impact of the FTP framework is reflected within Corporate/Other. We regularly assess the assumptions, methodologies and reporting classifications used for segment reporting, which may result in further refinements or changes to the framework in future periods. The application of the FTP framework impacts the measure of net interest income and, thereby, total net revenue and contribution profit (loss) for our Lending and Financial Services segments, as well as the total net revenue of Corporate/Other, but has no impact on our consolidated results of operations