SoFi's negative Free Cash Flow and why they use Bulls**t Earnings
The late Charlie Munger, one of the greatest investors of all time, famously said during the 2003 Berkshire Hathaway annual meeting, "Every time you [see] EBITDA just substitute the phrase bulls**t earnings". He expounded even further in 2020 saying, "Think of the basic intellectual dishonesty that comes when you start talking about adjusted EBITDA. You're almost announcing you're a flake."
Charlie Munger’s opinions are not to be taken lightly. Why then, am I so bullish on SoFi, who explicitly report adjusted EBITDA as their key profitability metric? I don't equate their adjusted EBITDA number to earnings, and neither should anyone else. In fact, not even their management thinks of it that way. This article is meant to shed a light on SoFi's profitability, or lack thereof, their cash flow, and add nuance to a discussion that is often portrayed as black and white.
A few words about profitability
I understand and appreciate that there are a lot of people out there who do not want to invest in any company that does not show positive GAAP net income. Fortunately, SoFi finally crossed that hurdle last quarter and is guiding to be profitable from here moving forward. That removes a large stigma from the stock.
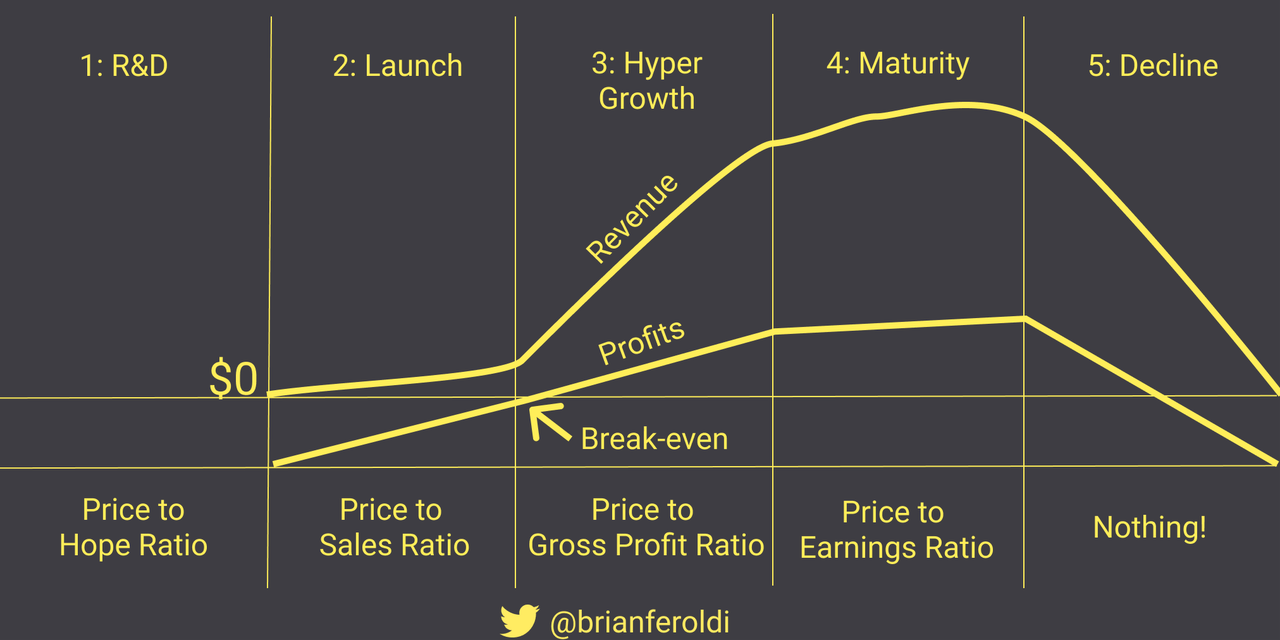
However, I think it’s important to frame how I think about investing. I am not overly concerned with GAAP profits for an earlier stage company that is rapidly growing revenue. I'll borrow a graphic from Brian Feroldi that illustrates the concept that I want to portray.
While I don't use the exact same framework as he does, the basic takeaway is that companies go through different phases as they grow and mature. Using Brian's framework, you would classify SoFi in a transition period between the Launch and Hyper Growth phase. The graphic also highlights the fact that proper valuation for a company changes depending on what phase the company is in. That’s something I totally agree with.
Personally, I’m not particularly bothered by the lack of GAAP EPS for an earlier stage growth company. A company that is currently unprofitable does not make it uninvestable. Virtually every investment made by angel investors or venture capitalists is in a nonprofitable company, and lots of them do just fine. A company can have negative GAAP earnings and still be an excellent investment, the two are not mutually exclusive. Fortunately for SoFi, this is not a discussion I’ll have to be having too much longer.
Cash Flow
Cash flow is the reason why you, I, and anyone who wants to understand SoFi should take adjusted EBITDA very seriously. The adjusted EBITDA that SoFi publishes is not a proxy for GAAP earnings. That's the wrong way to think about it, as was so colorfully articulated by Charlie Munger. However, that doesn't meant that the adjusted EBITDA metric is useless or that it is misleading to talk about it. It is actually extremely important because it serves as the starting point to calculate SoFi's cash flow.
How To Understand SoFi’s Cash Flows
This might be elementary for people who are used to looking at cash flows and balance sheets, but I want to break this down because it is often very misunderstood, especially for lenders. The first point to understand is that net income, free cash flow, and cash burn or generation are all separate things.
Net Income
First of all, SoFi's GAAP net income for 4Q23 was $48M. So that means its cash position improved by $48M between 3Q23 and 4Q23, right? Not at all. There are non-cash expenses that get accounted for in GAAP income but don't actually take the company's cash. Stock-based compensation (SBC) is one example. In 4Q23, SBC was $69M. They gave away $69M in stock, which is accounted for as a loss in net income, but doesn't actually change its cash reserves. If SBC were the only adjustment, they would have had $48M + $69M = $117M in 4Q23. There are other cash items and non-cash items (amortization, depreciation, gains and losses on investments, etc.) that need to be accounted for too. The point is that net income does not mean that's how much cash the company gained or lost.
Free Cash Flow
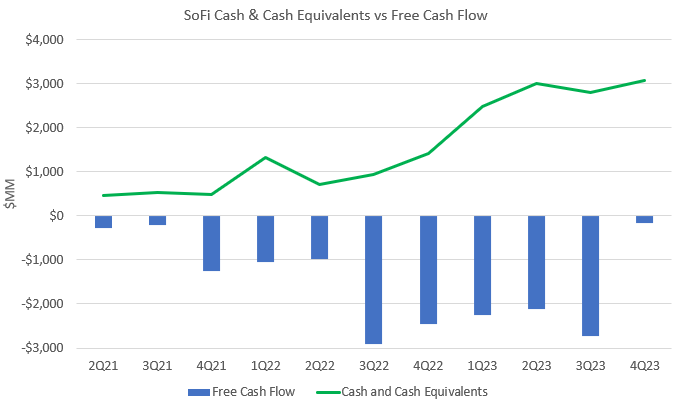
I must be looking for free cash flow (FCF). FCF is calculated as the Net Operating Profit after Taxes - Capital Investments. Net Operating Profit after Taxes excludes all those non-cash items we just discussed so that must be the right way to measure SoFi's burn rate. So let’s have a look at SoFi’s FCF since they became a publicly traded company.
If you take a running total, SoFi has a free cash flow of -$16.3B since going public. It averages a free cash flow of -$1.5B every quarter. Your immediate response is (and should be) that that is inconceivably high for a company whose total market cap has been hovering around $8B. If SoFi burns through $1.5B of cash every quarter, how in the world are they not bankrupt already, especially since it started 2022 with only $495M in cash and cash equivalents? Let’s add cash and cash equivalents to the chart above to see if we can tell how much cash SoFi is actually burning.
Cash has grown $462M to $3.1B during a time that their free cash flow totals -$16.3B. Does that seem reasonable to you? SoFi did raise $1.2B through a convertible note offering in 2Q21, and as a bank the cash number can be moved around by things like unused deposits. Other than the $1.2B in 2021, they have not raised a single dollar through any type of equity or debt offering in the periods shown, so how in the world can it have an FCF of -$16B and simultaneously bolster its cash reserves by ~$2.6B? It’s because while FCF is an excellent metric for measuring many companies, it's a terrible metric to focus on for a bank. Take a look at JPMorgan Chase’s quarterly free cash flow over the last 5 years:
JPM’s FCF has fluctuated between -$120B and +$101.2B and shows no trend at all. Now let’s compare that graph to JPM’s tangible book value per share over that same time period. Remember that, for better or worse, banks are often evaluated based on their Price:Tangible Book ratio.
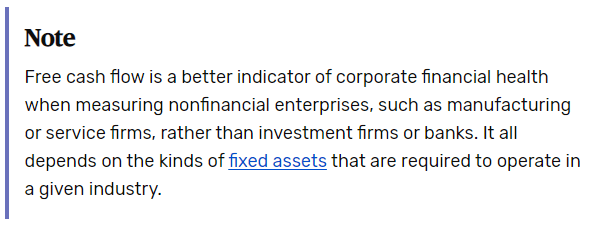
The reason why FCF is such a bad metric for financial institutions is because operating cash flow includes net change in operating assets. Banks main operating assets are their loans. If a bank is growing its balance sheet by increasing the amount of loans they are holding, then this gets reflected as negative FCF. SoFi is dramatically increasing the amount of loans they are holding because they received their bank charter in 1Q22. This is a limitation of FCF, and it's called out as such on various investment websites, here is one example:
An Analogy
I think it's easiest to understand this with an analogy in retail sales. Let's say I run a department store. To make the math easy, let's say I do $11M in sales in Q1, Q2, and Q3 and $33M in sales in Q4 because of Christmas and my margins are always 10%. Every quarter I need to refresh my inventory and purchase $10M of stuff to get $11M in sales. For this example, just assume inventory is my only expense.
In Q1, I sell $11M in inventory and buy $10M of stuff for Q2, I do this again in Q2. In Q3, I sell $11M of stuff but I have to buy $30M of inventory for Q4. In Q4, I sell my inventory for $33M and buy $10M for the next Q1. My free cash flow for each quarter is $1M, $1M, -$19M, and $23M. If you look at that -$19M quarter out of context, it looks bad. But the business is actually working the way it is supposed to and having negative FCF in Q3 makes sense.
Loans work the same way, but instead of building up inventory every quarter, it takes years. If SoFi originates more loans in a quarter than it sells on the debt market, the FCF for that quarter looks terrible even though it's actually a good thing for the business right now. Originating more loans is what makes more money in the long run. As long as it maximizes growth in profits and tangible book value, which is what we as shareholders want, it is the right thing to do for the business. However, whereas in the hypothetical retail example there was only one quarter of negative FCF, with SoFi, it has taken several years to grow the balance sheet. In fact, it is possible that it will continue into the future as long as they are reinvesting in growth, which they should be.
As mentioned above, the discrepancy between originations and loan sales has been exacerbated since the beginning of 2022 because that is when they received their bank charter. Having a bank charter allows SoFi to use its deposits as collateral to originate loans. This has drastically increased the length of time it is holding its loans before selling. In some instances, they are now even holding them to maturity. Extending their holding periods leads to more interest revenue before it sells the loans, increasing the revenue and profit margins on each dollar of loans it originates. That’s why it is not only reasonable but desirable for SoFi to have such negative FCF for the past two years. This is by design and it's good for the company.
Adjusted EBITDA may be BS earnings, but its super useful for SoFi's cash flow
Here is where it should become obvious why SoFi publishes its adjusted EBITDA. It is the closest accepted metric that gives an idea of their cash flow because it excludes non-cash items and excludes fluctuations of the balance sheet. Management has called this out, although many who do not follow the company closely probably missed it. Here is how CEO Anthony Noto put it on CNBC in 2022:
People are talking about about free cash flow, and that's typically defined as operating cash flow less capex, but for a financial services company, because you're using your cash to fund your loans, we believe EBITDA less capex is a better measurement of cash flow.
As he states, adjusted EBITDA by itself is not equivalent to cash flow because it also excludes a few real cash expenses. I disagree slightly with Anthony Noto here. He states that capital expenditures should be subtracted from adjusted EBITDA to get cash flow. I would also add that corporate interest expense is a real cash expense that must also be included. SoFi's cash flow is therefore:
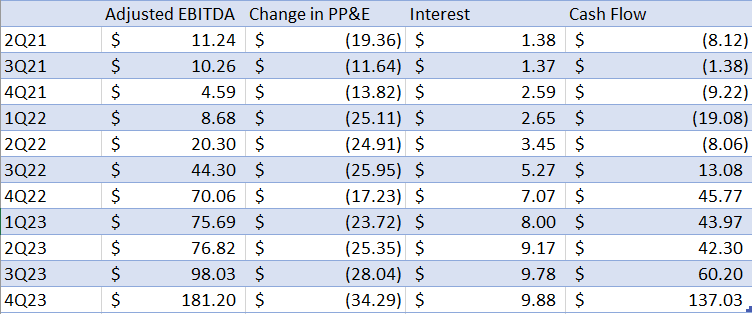
Cash Flow = Adjusted EBITDA - Change in PP&E (capex) - Interest expense on corporate borrowings
Note that other interest charges, like what they pay in APY on customer deposits, are included in their revenue and adjusted EBITDA calculations. Here is a table of SoFi's cash flow since going public:
SoFi first achieved positive cash flow in 3Q22. They are not burning cash and in fact their cash flow is increasing over time. They had no need to raise cash with their recent convertible note offering and were negotiating that offering from a position of strength, not of need.
Conclusion
Free cash flow, in general, is one of my favorite metrics for looking at a stock. However, the metric has obvious problems when dealing with companies that have large fluctuations in their operating cash flow like banks. Every metric falls short in some respects, and FCF falls very short when you are looking at asset-heavy sectors like banking. If you want to get a good approximation for SoFi’s cash flow, the best place to start is adjusted EBITDA.
SoFi has been a self-funding company since 3Q22 and will continue to be one moving forward. As of 4Q23, they are also a profitable business on a GAAP basis and will continue to be one moving forward. They have firm and stable cash flows and they are growing the business and tangible book value. Don’t be concerned if somebody talks about their free cash flow, it just isn’t a relevant metric for their business.
Subscriber update
I keep inching toward the YouTube channel goal of 100 paid subscribers. There has been some churn recently, but I’ll get there at some point.
Right now I am comfortable with taking the time to write about 2 articles every month. Once I get to 100 paid subscribers, I’ll start a YouTube channel and do at least one video every other week (I plan on also posting those on X).
Paid subscribers also get access to a private X chat. If you are a paid subscriber and not in the chat, please email me at datadinvesting@gmail.com and let me know and I’ll get you added. If you have any other ideas for things I can do to bring value to my paid subscribers, don’t hesitate to reach out.
Disclosures: I have long positions in SoFi.
The information contained in this article is for informational purposes only. You should not construe any such information as legal, tax, investment, financial, or other advice. None of the information in this article constitutes a solicitation, recommendation, endorsement, or offer by the author, its affiliates or any related third party provider to buy or sell any securities or other financial instruments in any jurisdiction in which such solicitation, recommendation, endorsement, or offer would be unlawful under the securities laws of such jurisdiction.


I would love for you to parse through NU Holdings 2023 Year End Financials to come up with "cash flow" using your methodology. Firstly they do not report "Adjusted EBITDA" so have to do a lot of footwork to arrive at that figure, PP&E is easy, but for Corporate Interest they report "Interest Paid" but does one just assume that is "Corporate Interest"... I see $1,030,530 Net Operating Income Less 82,904 (Interest Paid) then less 20,243 for PP&E for a net cash flow of $943,383 [but I'm using Net Operating Income instead of "Adjusted EBITDA".... probably close enough.