Final thoughts from SoFi Q1 Earnings
Just a few more tidbits that I found interesting or enlightening from the recent SoFi earnings report.
Financial Services Revenue and Margins
Cross sell has not been as strong as I’d hoped it would be. In fact, it is actually getting slightly worse. Total products per member since before they went public is shown below. One partial explanation is that they were forced to exit their crypto offerings, which certainly had a detrimental effect on the number of SoFi Invest products they had.
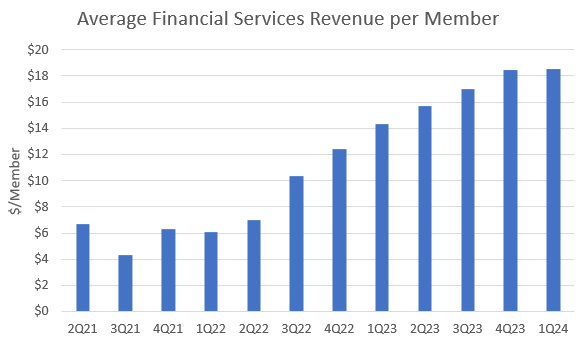
However, the efficiencies of the financial services productivity loop is manifesting in other ways. Even as greater numbers of members are joining each new quarter, they are monetizing those members better. The average financial services revenue per member shows this clearly. If they profitably scale the credit card business this year, then this number should continue to increase.
Moreover, financial services incremental revenue is very high margin. Here is the incremental contribution margin of each new dollar of FS revenue since they really started ramping that business.
In four of the last 7 quarters, incremental margins have been above 100%. In those quarters, not only has financial services been growing, but the directly attributable costs have actually often been shrinking. The FS segment has high fixed costs but low variable costs. The fact that it has gone from a contribution margin of -30% a year ago to 24% is honestly very impressive. They may incur some additional direct costs scaling the credit card business, so incremental margin may come down from these incredible numbers, but this is really impressive efficiency.
Debt
I recently wrote a deep dive into understanding SoFi’s debt. You can read it in full for more background, but I like to break down SoFi’s debt into two groups: cost-of-business debt and actual long-term debt. In essence, cost-of-business debt is debt that has a corresponding asset that is worth more than the debt. For example, a warehouse line of credit that costs them 6% interest, but they are using that money to fund a personal loan that makes them 13.5% interest. Actual long-term debt includes their convertible notes and corporate revolver. In that article I said this:
They are growing the deposit base at a faster rate than the loan book, which means that each subsequent quarter the amount of cost-of-business debt that they require is decreasing. As they decrease the speed of the balance sheet growth this year, it is within the realm of possibility that they do not require any of the warehouse facilities by the end of 2024.
I wrote that before it was clear exactly how much they are pulling back on lending. One of the consequences of that decision is that cost-of-business debt is declining way faster than I anticipated. The convertible note deal also offset some of the high-cost warehouse lines with low-cost convertible note debt as well. Here is their debt broken down into cost-of-business debt and actual long-term debt since Q3 2021.
Total debt peaked in Q2 2023 just shy of $6.5B. It is now down to $2.9B and the vast majority of the decrease is from offsetting the warehouse lines of credit with deposits and with the cash raised from the issuance of the 2029 senior convertible notes last quarter. There is a decent chance that they’ll have extinguished virtually all of their cost-of-business debt by the end of this quarter. SoFi investors will probably never again hear the argument about how SoFi has too much long-term debt again. In fact, for the first time ever, cash and cash equivalents ($3.69B) was higher than total debt ($2.89B).
Weighted Average Cost of Capital
This dovetails nicely with the discussion about cost-of-business debt. SoFi offsetting so much of their warehouse debt with lower cost debt led to them decreasing their total weighted average cost of capital (WACC) for the first time since rate hikes started. Even though a greater percentage of their capital was coming from low cost deposits each quarter, the APY they gave out on those deposits and the rate that warehouse facilities were charging continued to increase. That meant that overall, SoFi was still paying more for their capital each and every quarter.
Now that rates have been steady for a while and deposits are offsetting so much of their previously drawn warehouse lines, overall WACC is on the decline. Note that my WACC only includes the cost of their deposits and warehouse facilities. I ignore cost of capital provided by convertible debt or their own cash because it’s hard to know exactly how much of that is going towards funding loans. So this number is slightly higher than their actual WACC.
Decreasing WACC should continue from here into the future. Increasing deposits while having a more cautious approach in lending will be a big tailwind. Additionally, the Fed is going to reduce the quantitative tightening starting this summer and the next move in interest rates is much more likely to be a rate cut than a rate hike. That means SoFi’s WACC has almost certainly peaked. The small decrease from Q4 to Q1 might not look like much, but all else being equal, going from a WACC of 4.68% to 4.49% meant an extra $42M in net interest income in Q1.
NIM is increasing across every loan type, but decreasing as a whole
SoFi publishes their weighted average interest rate earned each quarter for each of their loan types (personal, student, and home). Combining this with the WACC above, we can get net interest margin (NIM) for each type of loan they offer. A little caveat to this graph is that the weighted average interest earned for each Q4 is for the entire year rather than just the quarter. Since rates are increasing, this makes Q4 numbers look artificially low, which is NIM decreased slightly in Q4. I debated with the idea of removing Q4 numbers entirely, but decided to keep them in anyway. SoFi gives enough data on the WACC that I can calculate it independently for Q4, so it does not have that problem.
You’ll notice looking at the graphs that the net interest margin across all loan types is increasing. The reason for this is two-fold. First, as covered above, WACC came down for the first time in a while. Just as importantly, SoFi has been raising the APR they charge across all types of loans offered. This is evidence that they are operating from a position of strength. Despite the fact that the Fed Funds rate has been flat since last July, SoFi has continuously been able to raise the rates on the loans they offer. This is because they have ample and continuing demand from their consistent member growth. And this is in spite of the fact that they have been tightening lending standards during that time period as well, which typically means having to offer lower interest rates.
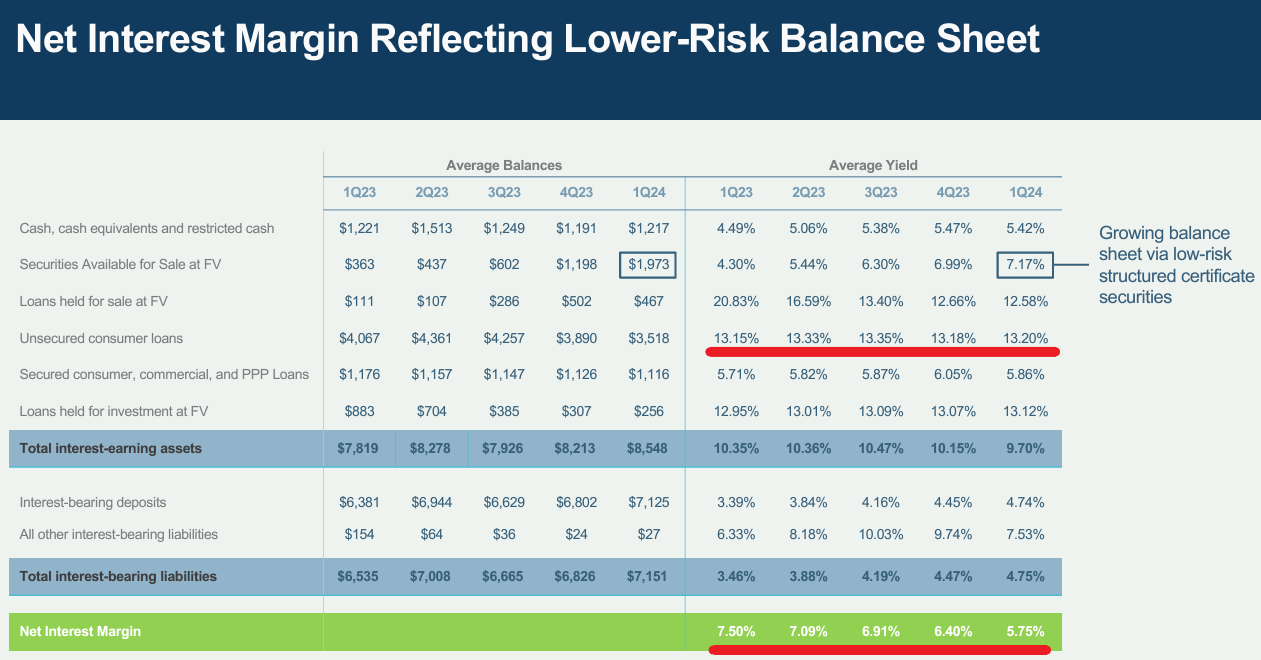
Let’s compare that to LendingClub. LendingClub’s APR on their loans peaked two quarters ago and has come down a little since then (look at the average yield on their unsecured consumer loans). Moreover, LendingClub’s WACC is still rising quickly (labeled “Total Interest-bearing liabilities” below). In fact, despite the fact that SoFi is still using warehouse lines and is crushing LendingClub in deposit growth, Q1 was the first time ever that SoFi’s WACC was lower than LendingClub’s (see the comparison of deposit growth in this article if you are interested in the deposit growth data).
Getting back to SoFi, their overall NIM decreased in Q1 from 6.02% to 5.91%, as shown in their earnings presentation below. If NIM across each lending type is increasing, why then did the overall NIM decrease?
This has a simple explanation. The overall loan portfolio shifted slightly toward student loans from personal loans. Student loans have lower NIM than personal loans, so overall NIM decreased. To be fair to LendingClub, part of the reason for their NIM contractins is that they are similarly shifting to structured certificates rather than building their unsecured loan portfolio. Structured certificates have lower interest revenue, but also carry lower risk. However, LendingClub’s NIM has been contracting for over a year now, and was contracting before the strategic switch. SoFi’s NIM has been on an upward trajectory during that same time period.
When I first saw the NIM compression from Q4 2023 to Q1 2024 in the SoFi Q1 presentation I was curious as to why it happened. I have that answer now. After looking into it and realizing that margins are expanding for each loan type individually, I’m not concerned in the slightest.
Conclusion
Ok, this was the last batch of things that I thought were interesting and worth sharing that came out of the earnings. I have several ideas for my next article but I want to get a pulse on what my readers actually want, so I’m putting a poll here at the end. I still reserve the right to write about whatever I please, but I’d rather get some input about what is most interesting to my audience.
Subscriber update
Right now I am comfortable with taking the time to write about 2 articles every month. Once I get to 100 paid subscribers, I’ll start a YouTube channel and do at least one video every other week (I plan on also posting those on X).
Paid subscribers also get access to a private X chat. If you are a paid subscriber and not in the chat, please email me at datadinvesting@gmail.com and let me know and I’ll get you added. If you have any other ideas for things I can do to bring value to my paid subscribers, don’t hesitate to reach out.
Disclosures: I have long positions in SoFi and LendingClub.
The information contained in this article is for informational purposes only. You should not construe any such information as legal, tax, investment, financial, or other advice. None of the information in this article constitutes a solicitation, recommendation, endorsement, or offer by the author, its affiliates or any related third party provider to buy or sell any securities or other financial instruments in any jurisdiction in which such solicitation, recommendation, endorsement, or offer would be unlawful under the securities laws of such jurisdiction.


